What are the Glasgow Coma Scale Pupils Age Prognostic charts?

Using Prognostic Information after a head injury
The GCS Pupils Age prognostic charts provide a simple graphical presentation of the probabilities of outcome from traumatic brain injury based on GCS, pupil reactivity, age and CT scan findings. They were developed by Gordon Murray, Paul Brennan and Graham Teasdale, and published by the Journal of Neurosurgery in 20181 (Link).
The stimulus to the development of the Charts was that despite several decades of interest and descriptions of more than 100 methods for making predictions of an individual patient’s outcome, these have not found a role in clinical practice. This leaves decisions about patient care exposed to the influence of clinicians personal, highly variable, subjective opinions, which tend to be overly pessimistic.2 This may reflect clinicians’ unease about dealing with explicit, calculated mathematical probabilities, a lack of clarity about the influence of their various components and opaqueness about the process of deriving the prediction as well as the lack of utility from the extra work required.
The Charts are a user-friendly, graphical displays that bring together information about four of the most important features relating to outcome after a head injury in a way that can be easily applied clinically.
Construction of the charts
The Charts are derived from information about 10,702 adult head injured patients.1
Outcome 3 – 6 months after injury was classified into 2 groups: either mortality (includes 1.3% judged to be in vegetative state) or favourable, independent recovery (Moderate disability or Good recovery on Glasgow Outcome Scale)
Clinical features: The clinical indices of prognosis, the GCS Score and the pupil reactivity, are brought together in a combined GCS-P score.3 This is obtained by subtracting the Pupil Reactivity Score (PRS) ( 0 – 2) from the Glasgow Coma Scale (GCS) total score ( 3 -15):
GCS-P = GCS – Pupil Reactivity Score
The GCS-P has a range of 1–15 over which there is a continuous fall in mortality from 79% to 14% and increase in favourable outcome from 11% to 80%. Further information on assessment of the GCS and GCS-P can be accessed here.
Age: Outcome worsens progressively with increasing age. In victims aged 16 – 18 yrs the rate of mortality is 18% and of favourable recovery 68%; among those aged 86 yrs or older mortality is 77% and the rate of favourable outcome 10%.
CT Scan findings: The severity of structural brain damage shown by the CT scan is categorised by the presence or absence of three main findings: a hematoma, subarachnoid haemorrhage or absence of the basal cisterns. Mortality rises and the rate of favourable outcome falls as the number of abnormal findings increase.
Number of abnormalities
0
1
2 or more
Mortality rate
10%
24%
45%
Favourable Outcome
77%
57%
38%
Combined Charts
Age GCS-P
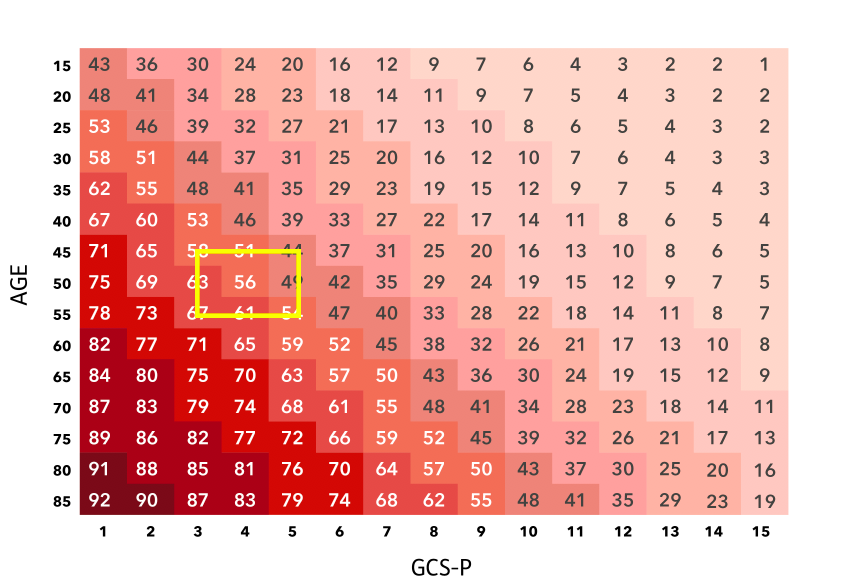
The combined effects of GCS-P and age are displayed on 2D charts (download) with increasing GCS-P along the ‘x’, horizontal axis, and age decreasing in 5 year bands from over 86 to 16 on the ‘y’, vertical axis. The data are the percentage likelihood of either mortality (death or persistent vegetative state) or independent favourable outcome (Glasgow Outcome Scale moderate disability or good recovery) at 3-6 months after injury. Prognosis is poorer for combinations towards the bottom left hand corner of the chart and, conversely, better for combinations towards the top right hand corner.
CT Scan findings
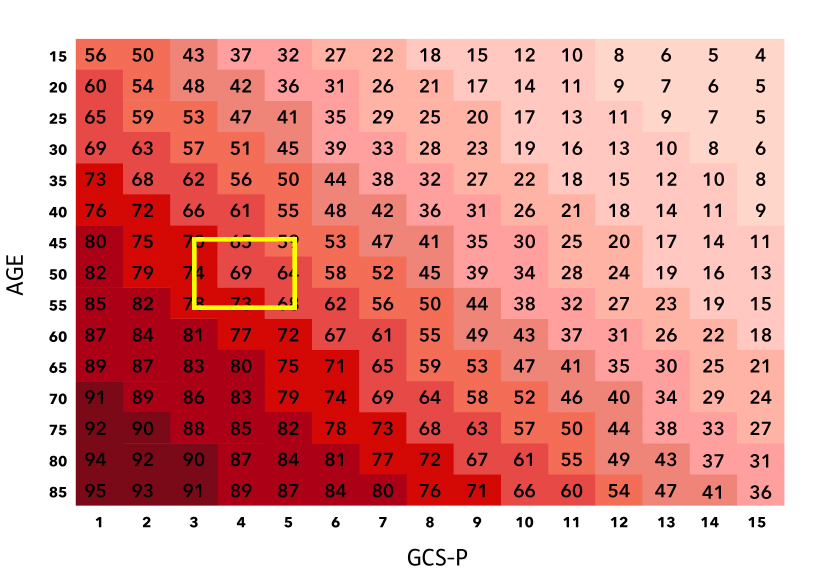
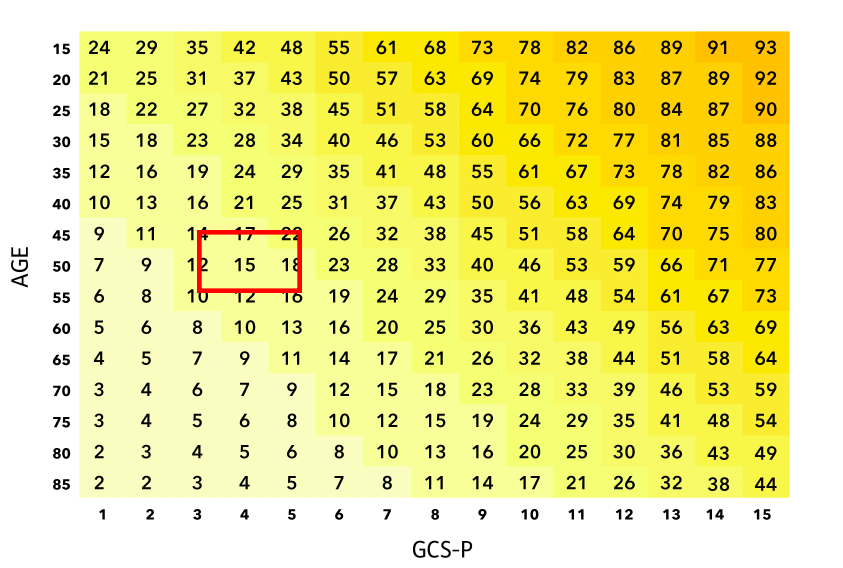
Separate GCS-PA charts show prognosis according to if the patient’s scan shows none, only one, or two or more of the specified abnormalities.
Using the GCS_PA Charts
Example of application.
Age, GCS and Pupil Response
You are asked to assess a 50 year old patient who has been ejected from the passenger seat of a car at high velocity. They make no eye, verbal or motor movements spontaneously, or in response to your spoken requests. When stimulated their eyes do not open, they make no sounds, but their arms flex normally. This can be scored as E1V1M4 using the Glasgow Coma Scale, giving a sum score of 6.
You now test their pupil reactivity to light. Neither pupil is reactive to light. This gives a Pupil reactivity Score (PRS) of 2.
The GCS-P can then be determined as GCS - PRS, which in this case is 6 - 2 = 4.
The estimate of 6 month mortality is made from the location in the charts of the cell identified by these features:
% Mortality
% Favourable outcome
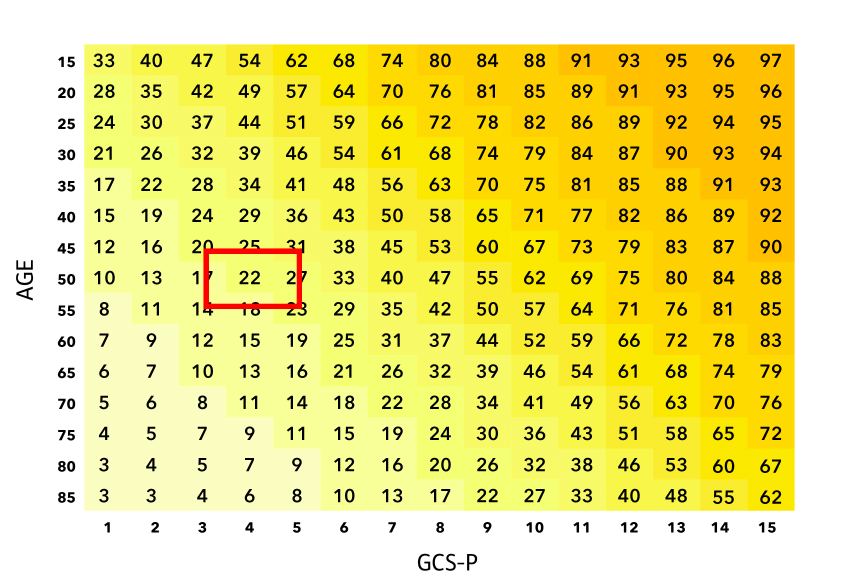
The estimate is Mortality 56%. Independent recovery 22%
CT Findings
The patient’s CT scan shows a subdural haematoma and subarachnoid haemorrhage (2 abnormalities), so the estimate of mortality has increased to 69% and of independent recovery has fallen to 15%.
% Mortality
% Favourable outcome
Frequently asked questions
1. What guidance do the charts provide to the likelihood of severely disabled survival?
This can be obtained by subtracting the estimates for mortality and independent recovery from 100%. In the example above, based on age and GCS-P, the chance of death is 56% and of favourable outcome is 22%, so the chance of survival with severe disability is 100%-56%-22% = 22%. After incorporating the CT scan findings the estimate of mortality increases to 69% and that of independent recovery falls to 15%, together these make the likelihood of a severely disabled survival is 16%.
2. Why were more detailed descriptions of CT findings not used?
The Charts have been designed to be simple to use. We demonstrated that more complex systems did not add substantially to the information gained about patient outcome following head injury from these simple descriptors of the CT findings.
3. Is there a differentiation between big and small haematomas?
With this chart system, the size of haematoma does not affect the predicted outcome.
References
- Murray GD, Brennan PM, Teasdale GM: Simplifying the use of prognostic information in traumatic brain injury. Part 2: Graphical presentation of probabilities. J Neurosurg. 128(6):1621-1634. 2018
- Moore NA, Brennan PM, Baillie JK: Wide variation and systematic bias in expert clinicians’ perceptions of prognosis following brain injury. Br J Neurosurg 27:340–343, 2013
- Brennan PM, Murray GD, Teasdale GM. Simplifying the use of prognostic information in traumatic brain injury. Part 1: The GCS-Pupils score: an extended index of clinical severity J Neurosurg 128:1612–1620, 2018